Undergraduate Student Outcomes
Know Where You’re Going, By Graduation
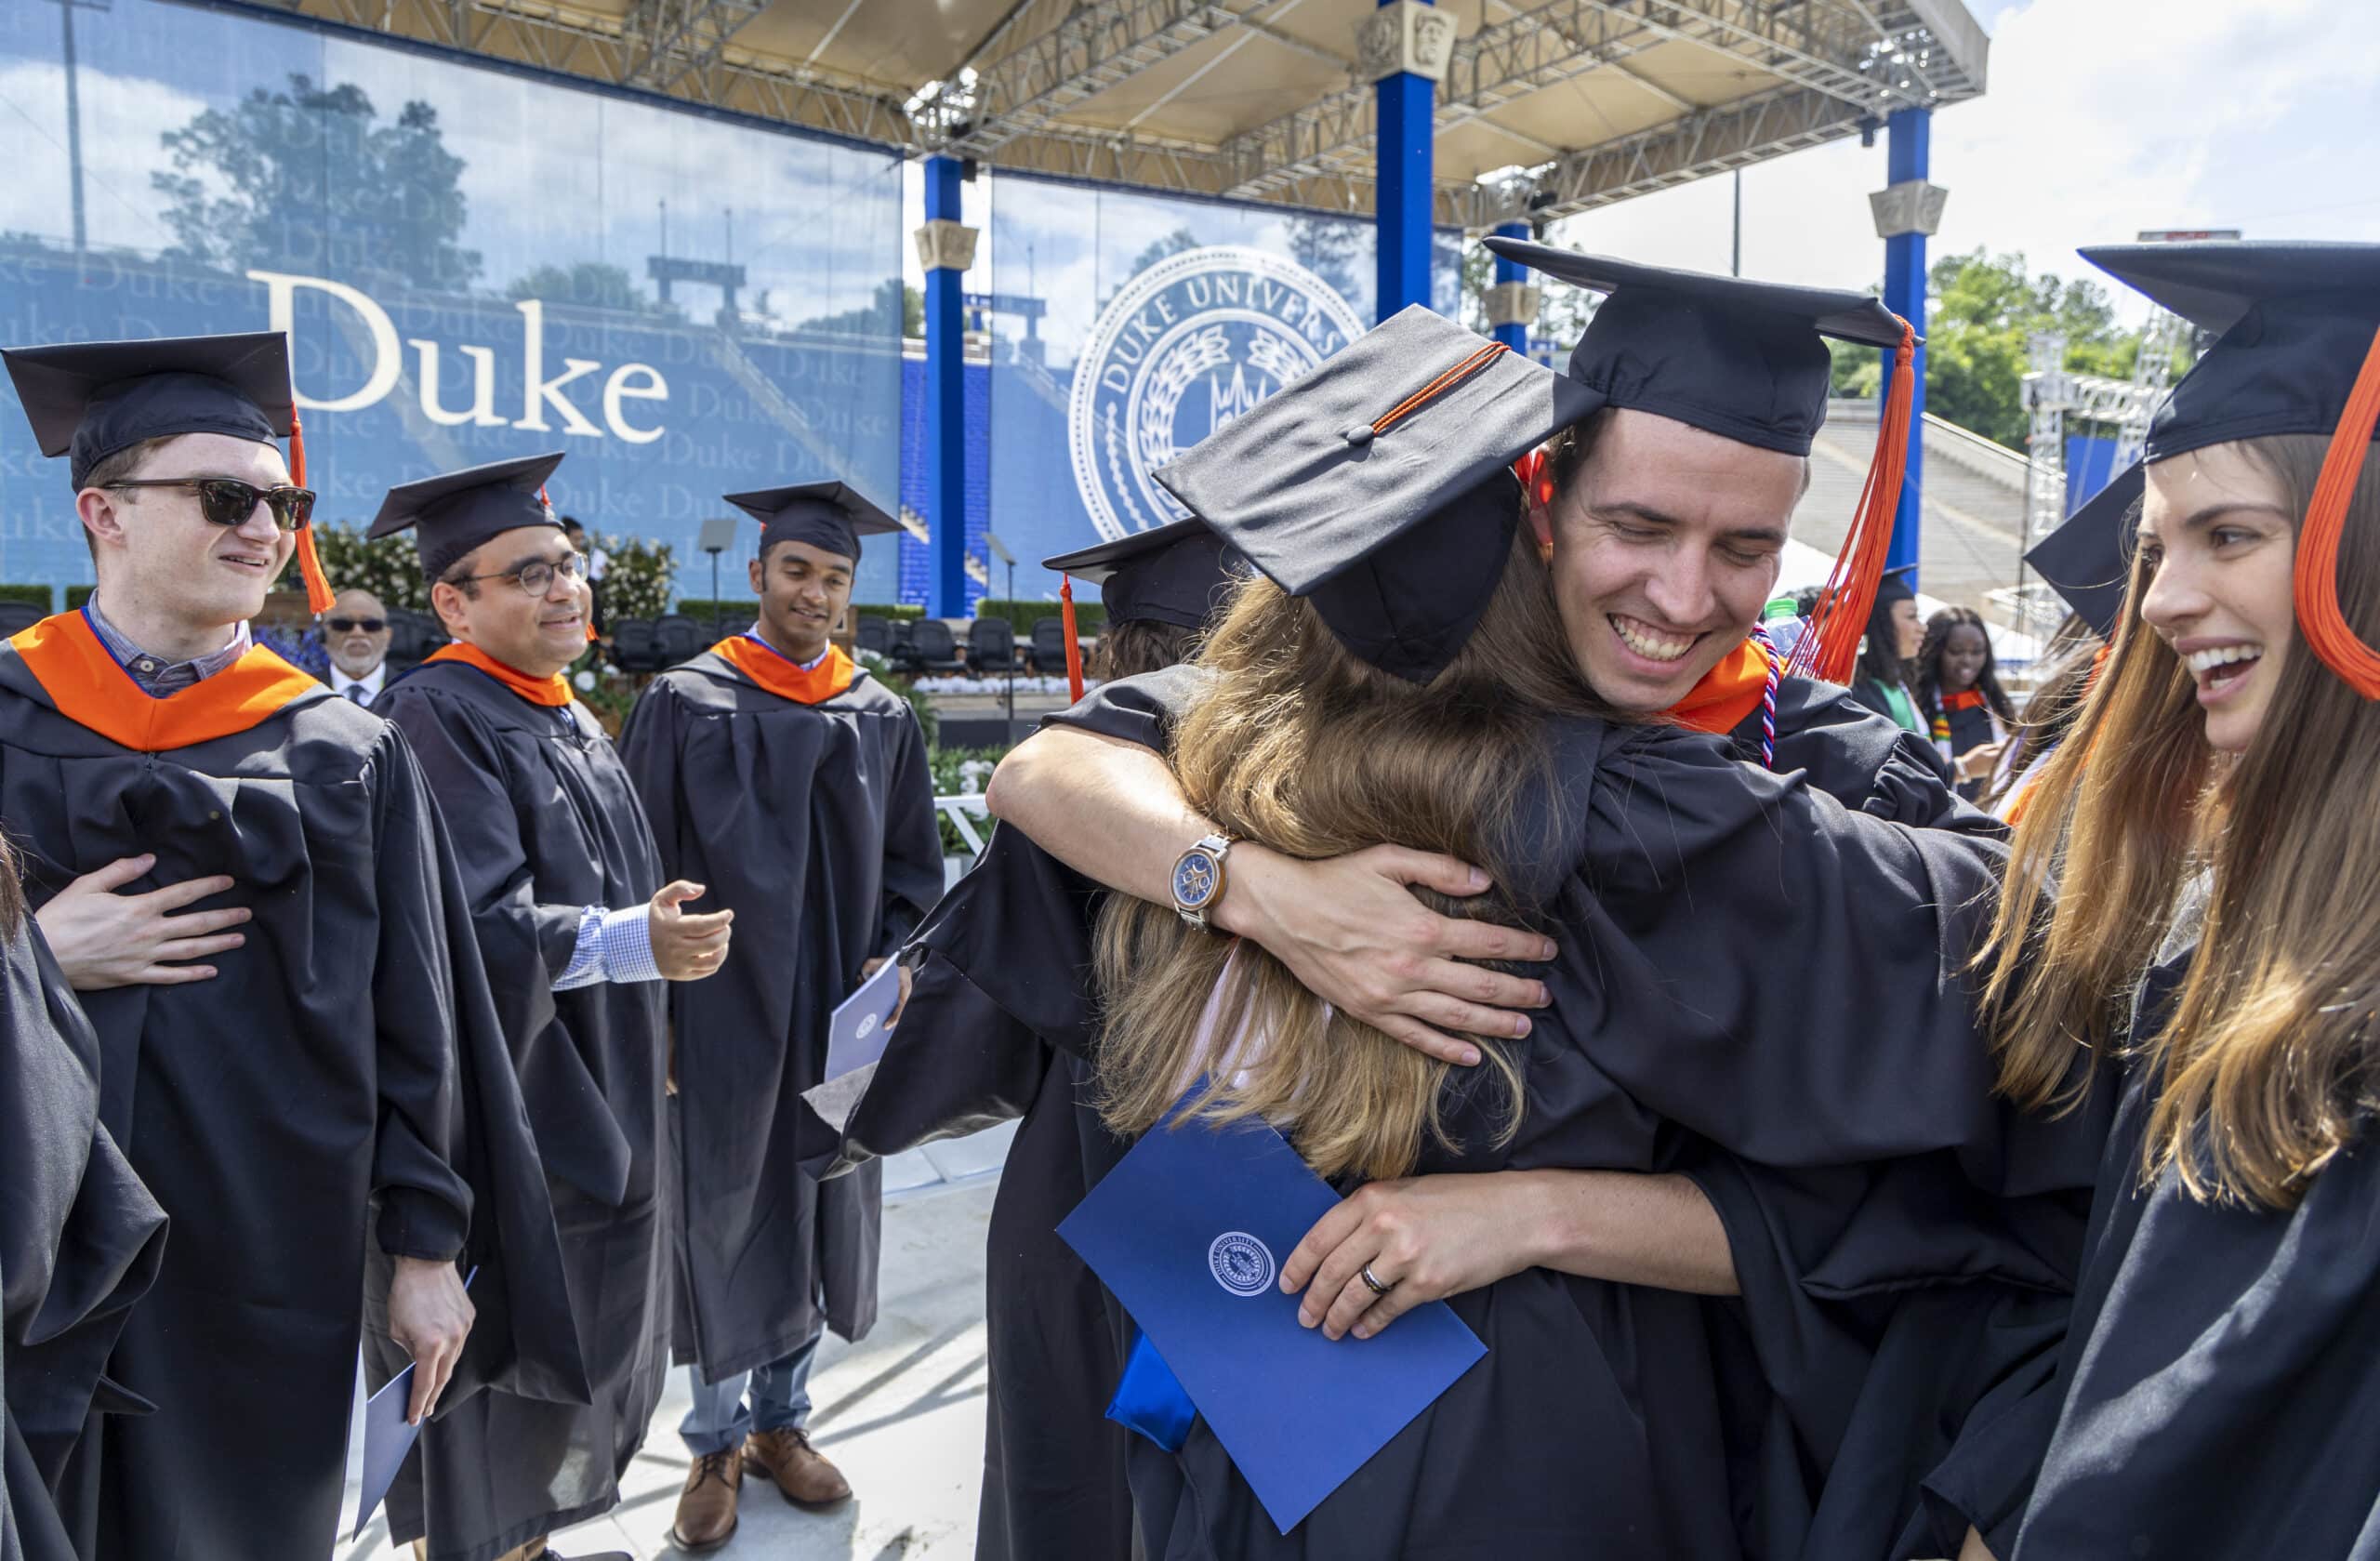
After four years with us, you’ll have learned a lot. How to work in diverse teams. How to apply technical know-how. How to succeed after failure. But perhaps most importantly, you’ll have discovered a lot about your purpose.
Understanding their purpose means that most of our graduates know where they’re heading—well before putting on the mortarboard and shaking hands with the dean.
Enrollment & Graduation Rates
| Academic Year | Total Undergraduates | Degrees Awarded |
|---|---|---|
| 2024 | 1,363 | 272 |
| 2023 | 1,314 | 290 |
| 2022 | 1,278 | 289 |
| 2021 | 1,289 | 278 |
| 2020 | 1,212 | 283 |
Total undergraduates at the beginning of the fall semester. Degrees awarded for the academic year, first major only.
Student Learning Outcomes
Our students will have the following capabilities upon completion of their degrees:
- An ability to identify, formulate, and solve complex engineering problems by applying principles of engineering, science, and mathematics
- An ability to apply engineering design to produce solutions that meet specified needs with consideration of public health, safety, and welfare, as well as global, cultural, social, environmental, and economic factors
- An ability to communicate effectively with a range of audiences
- An ability to recognize ethical and professional responsibilities in engineering situations and make informed judgments, which must consider the impact of engineering solutions in global, economic, environmental, and societal contexts
- An ability to function effectively on a team whose members together provide leadership, create a collaborative and inclusive environment, establish goals, plan tasks, and meet objectives
- An ability to develop and conduct appropriate experimentation, analyze and interpret data, and use engineering judgment to draw conclusions
- An ability to acquire and apply new knowledge as needed, using appropriate learning strategies.
Outcomes by Major
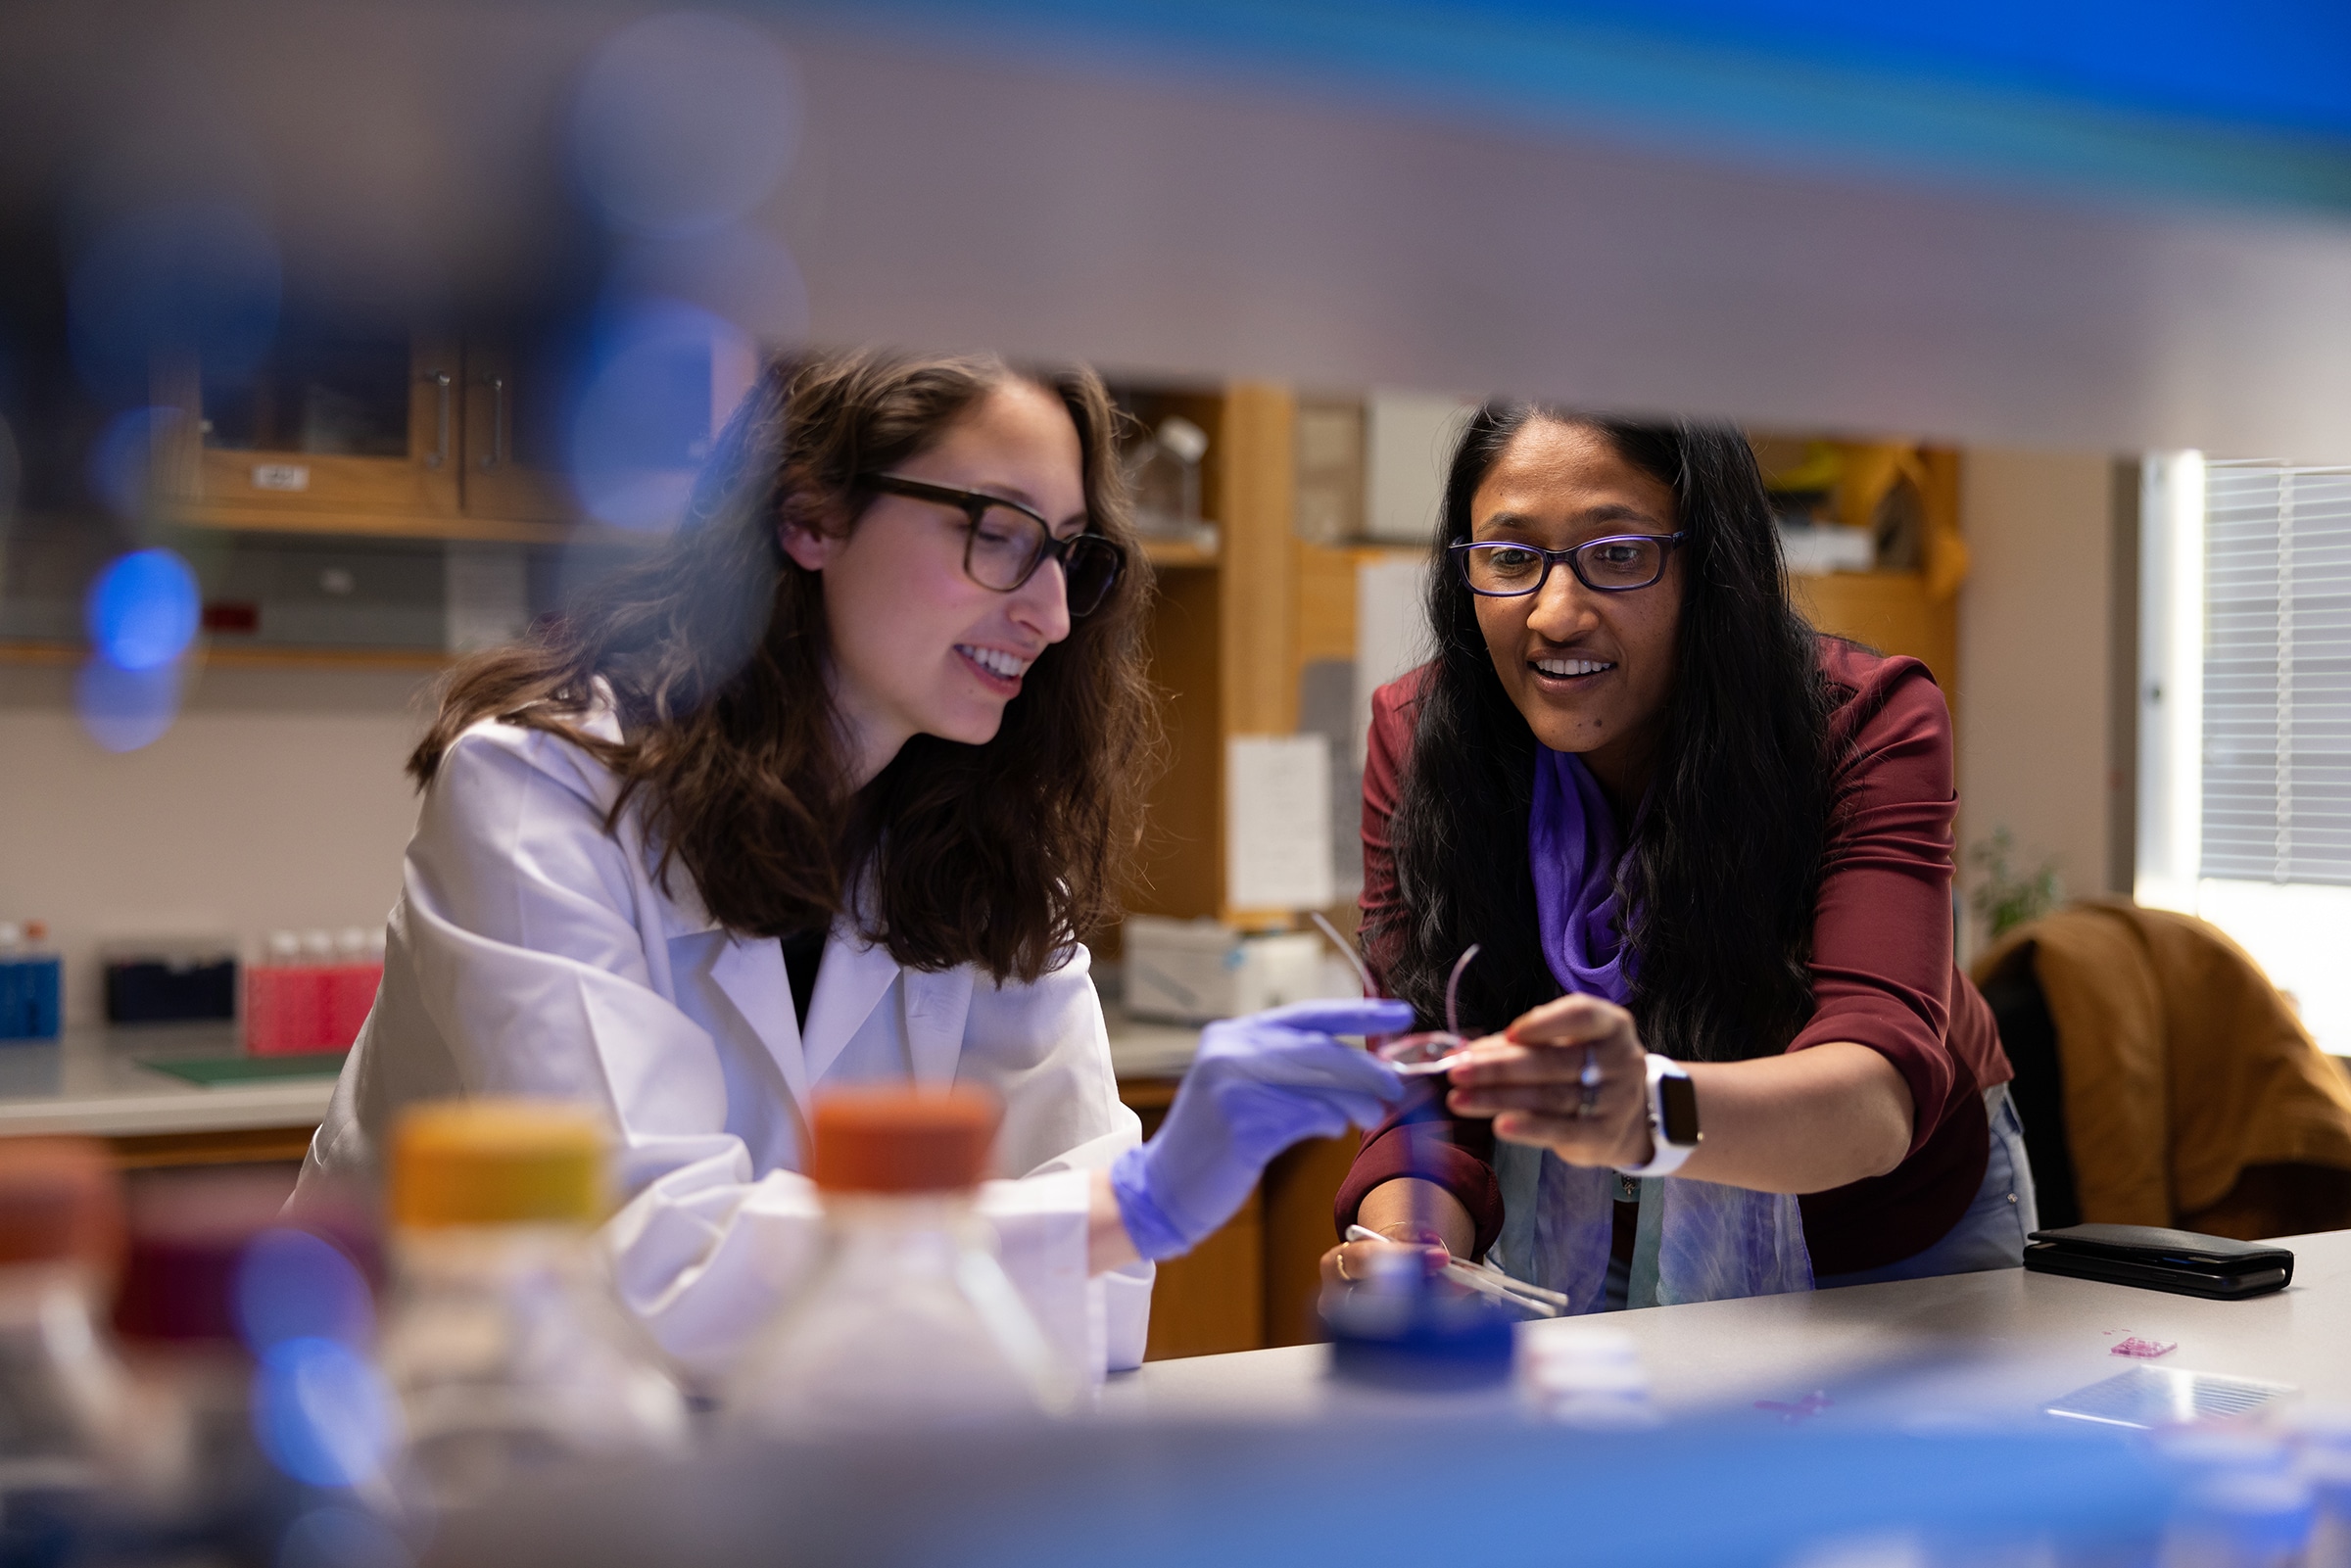
Biomedical Engineering
Our BME graduates work in medical device design and development, consulting, medicine and biotechnology. About half go to work full-time after graduation. About 40% transition to grad school or medical school.
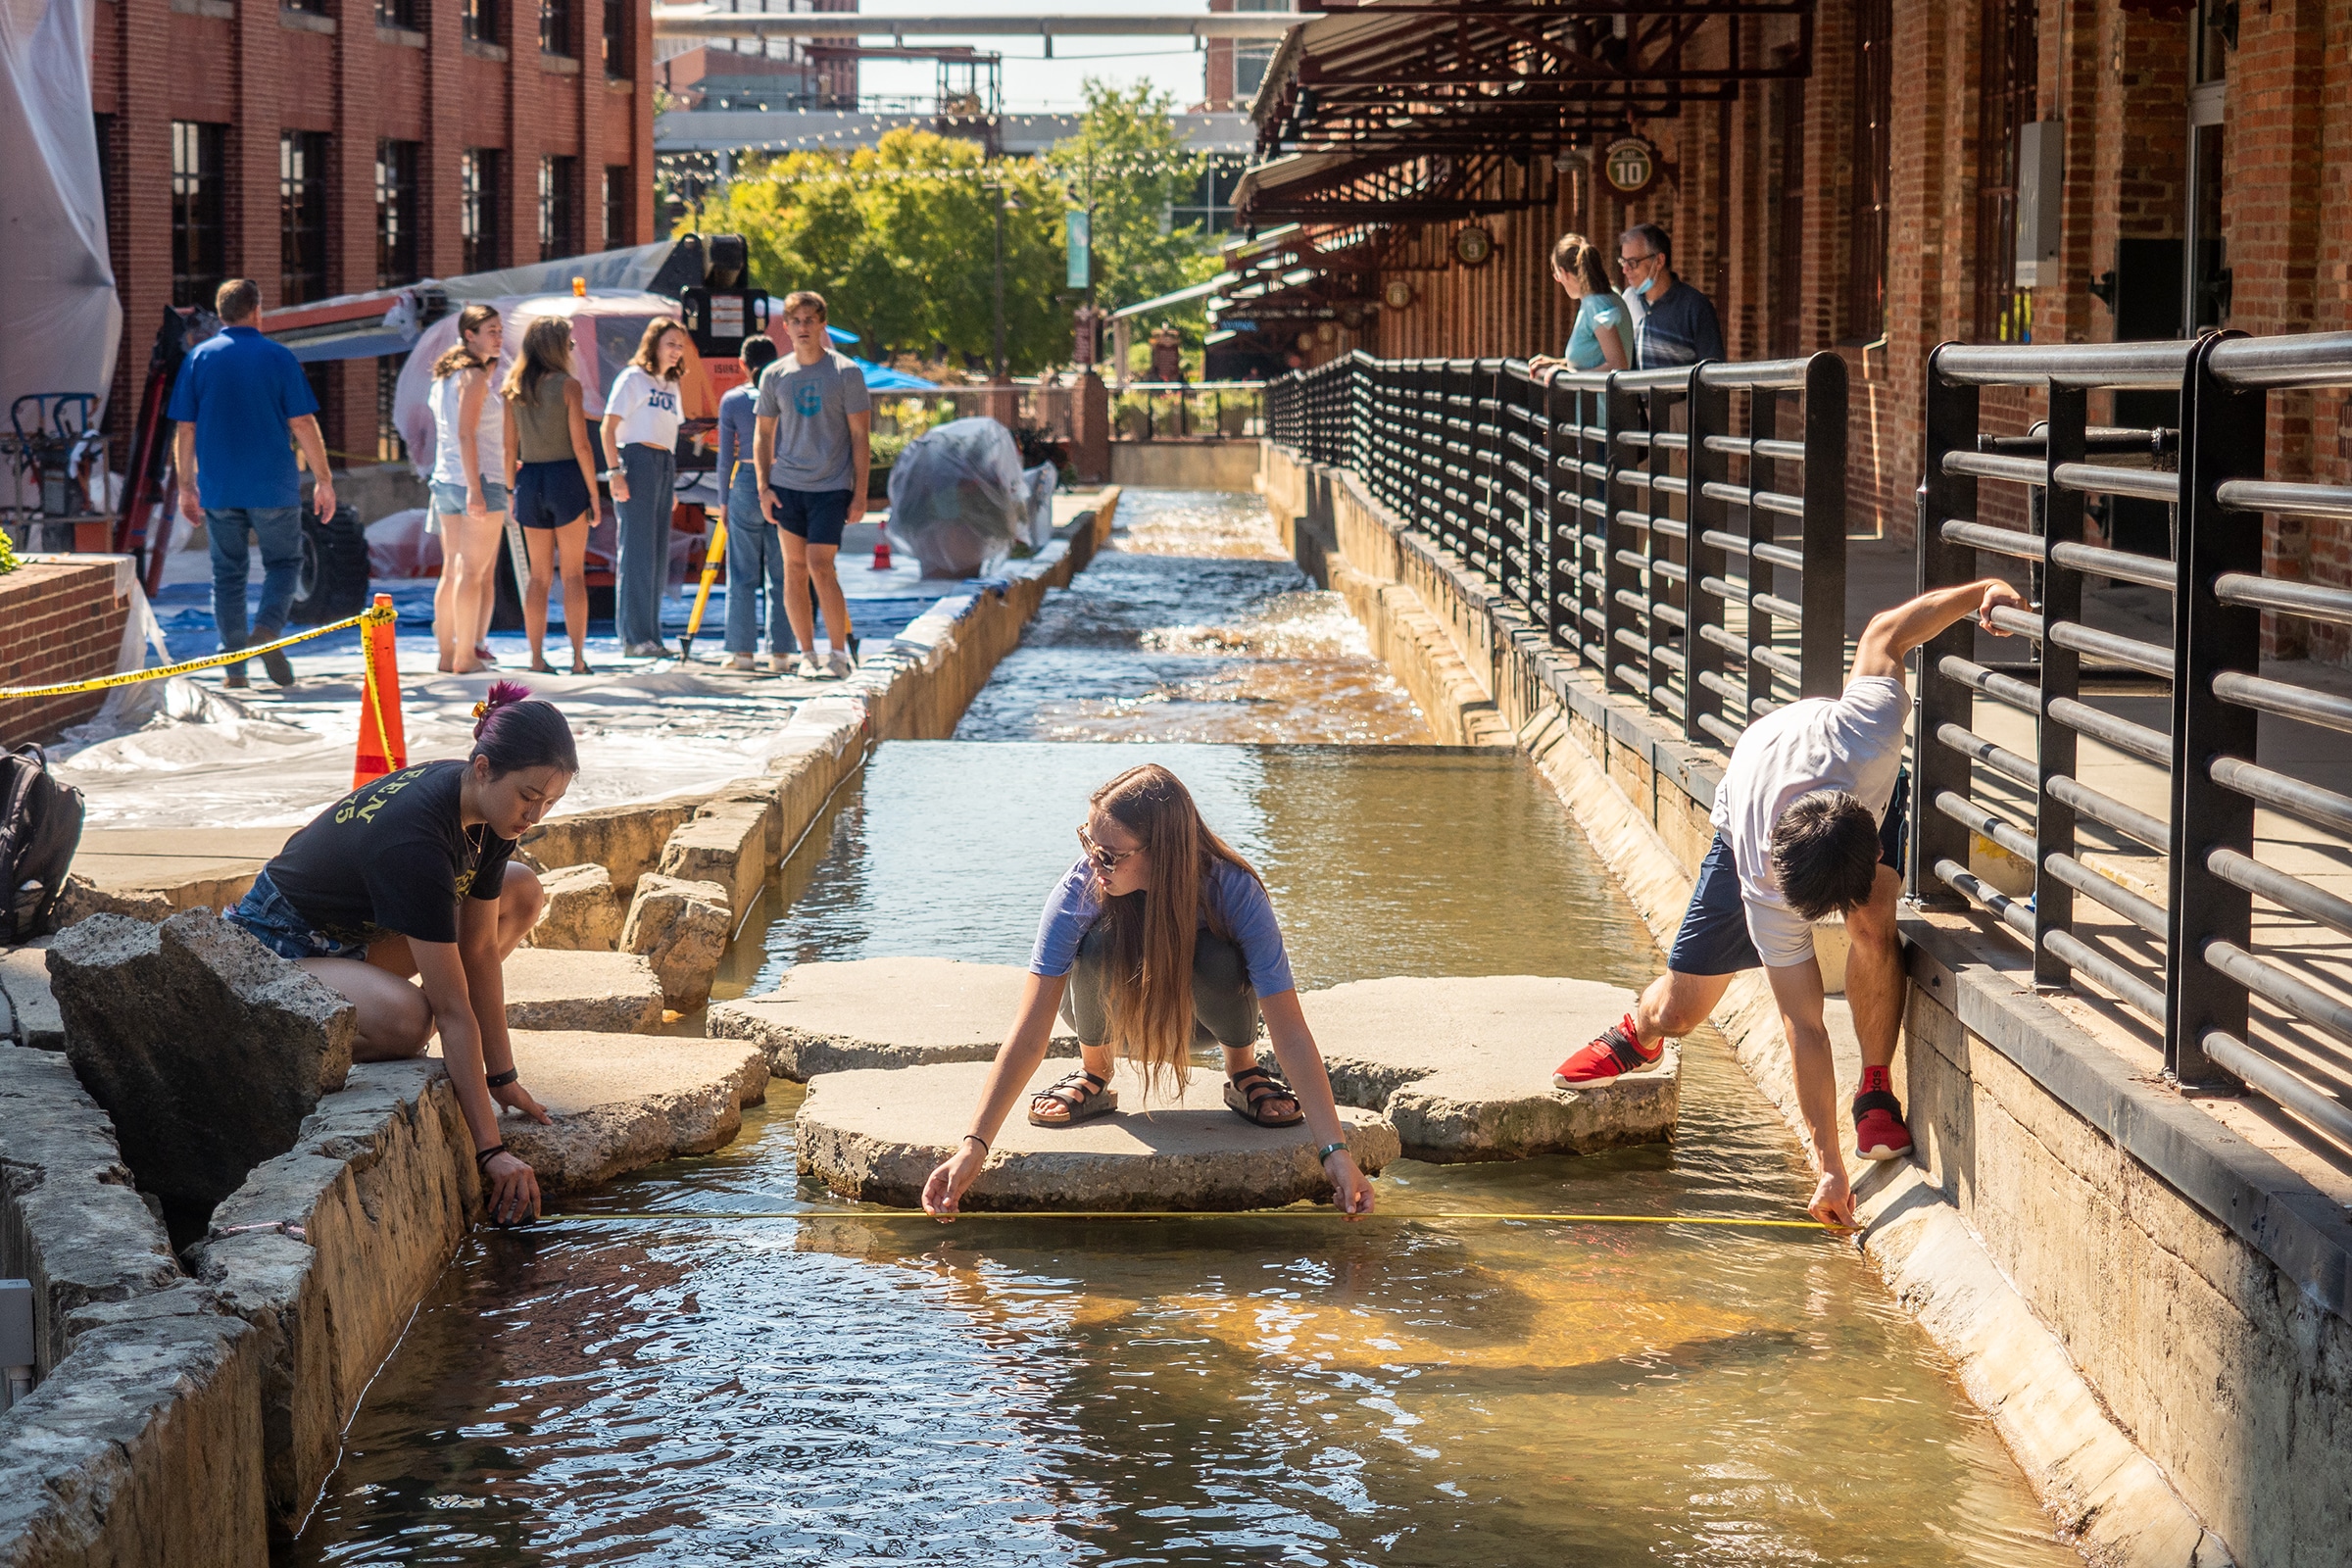
Civil & Environmental Engineering
CE grads design public infrastructure—systems that deliver utilities or facilitate travel, communication and commerce. EnvE majors work on controlling pollution and making communities resilient to climate change and disasters. About two-thirds go into full-time work after graduation; a third went on to grad school.
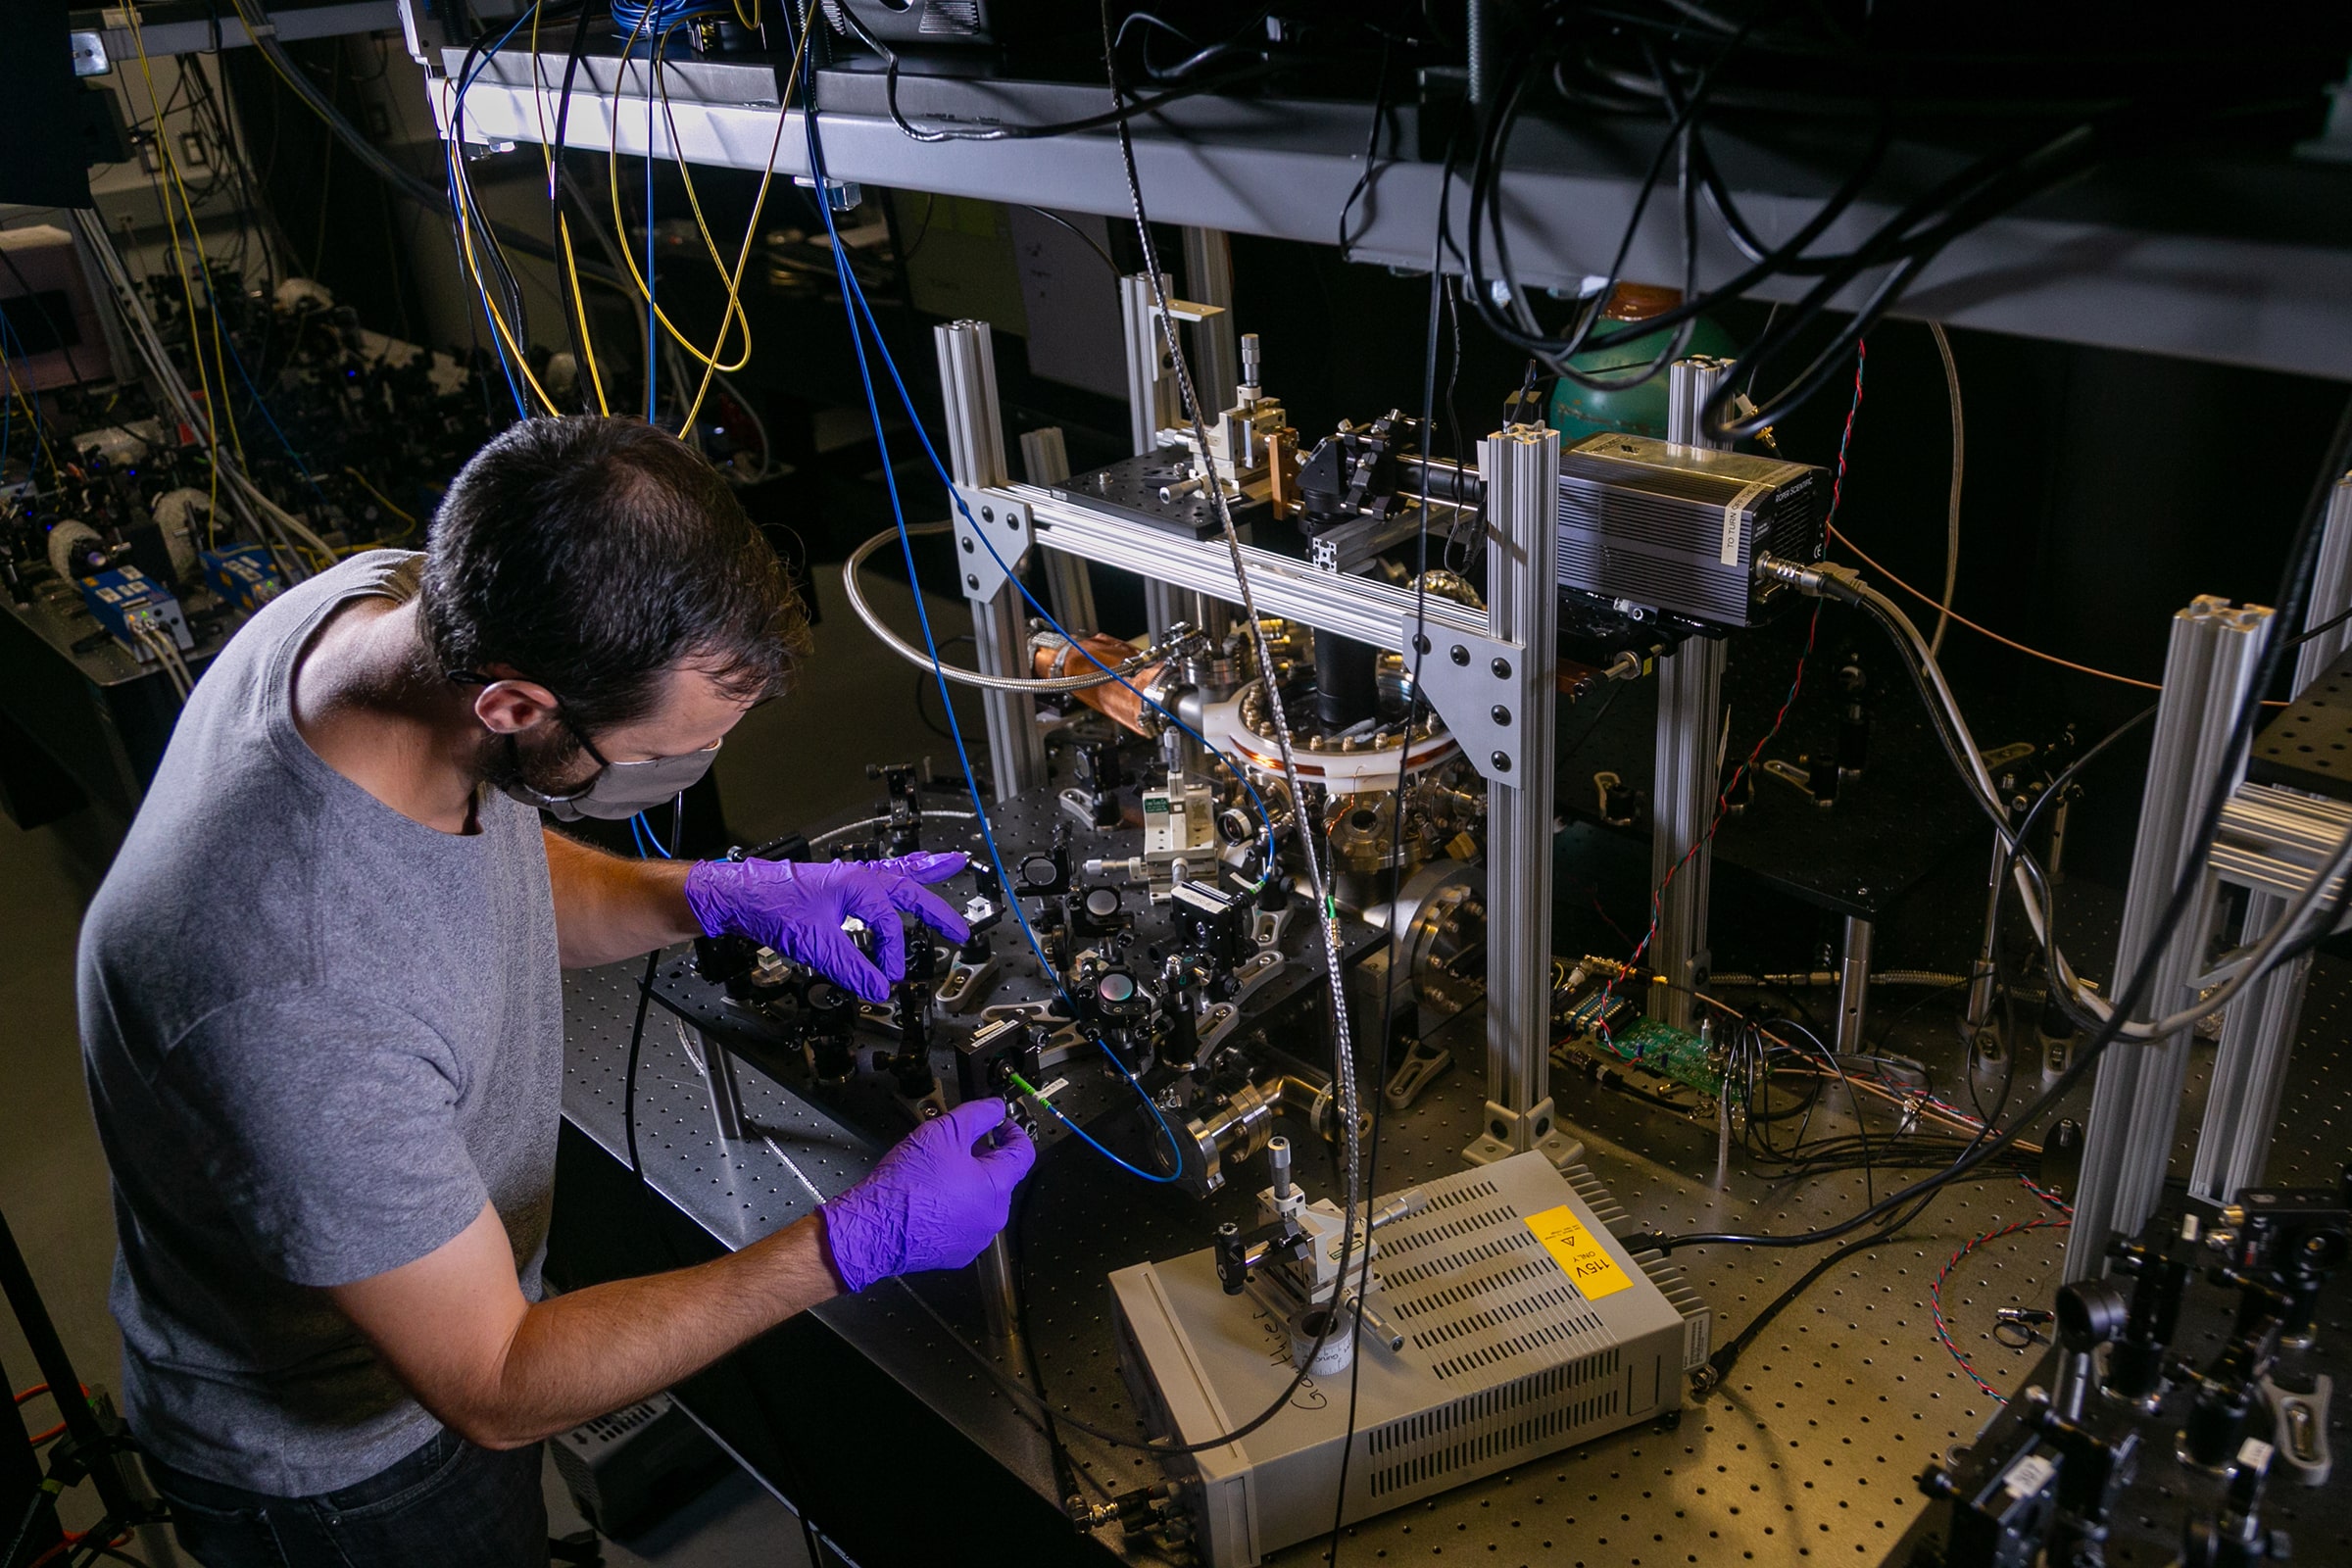
Electrical & Computer Engineering
ECE grads apply their knowledge of AI, machine learning, electrical systems and electronics to design software and hardware. Nearly 80% go into full-time work. About 15% attend graduate school.
Mechanical Engineering
These graduates design machines that make life better. Recent grad have roles working with advanced tech touching on robotics, aerospace and health care. About two-thirds go into full-time work. A third transition to grad school.
Interested in joining our community?
Join our mailing list to receive information and invites.