AI Pinpoints Local Pollution Hotspots Using Satellite Images
By Ken Kingery
Technique could find sources of heavy air pollution and allow researchers to better study its effects on human health and make socially just policy decisions
Researchers at Duke University have developed a method that uses machine learning, satellite imagery and weather data to autonomously find hotspots of heavy air pollution, city block by city block.
The technique could be a boon for finding and mitigating sources of hazardous aerosols, studying the effects of air pollution on human health, and making better informed, socially just public policy decisions.
“Before now, researchers trying to measure the distribution of air pollutants throughout a city would either try to use the limited number of existing monitors or drive sensors around a city in vehicles,” said Mike Bergin, professor of civil and environmental engineering at Duke. “But setting up sensor networks is time-consuming and costly, and the only thing that driving a sensor around really tells you is that roads are big sources of pollutants. Being able to find local hotspots of air pollution using satellite images is hugely advantageous.”
“It’s a big advantage to be able to find a specific neighborhood that tends to stay higher or lower than everywhere else, because it can help us answer questions about health disparities and environmental fairness.”
– David carlson
The specific air pollutants that Bergin and his colleagues are interested in are tiny airborne particles called PM2.5. These are particles that have a diameter of less than 2.5 micrometers — about three percent of the diameter of a human hair — and have been shown to have a dramatic effect on human health because of their ability to travel deep into the lungs.
The Global Burden of Disease study ranked PM2.5 fifth on its list of mortality risk factors in 2015. The study indicated that PM2.5 was responsible in one year for about 4.2 million deaths and 103.1 million years of life lost or lived with disability. A recent study from the Harvard University T.H. Chan School of Public Health also found that areas with higher PM2.5 levels are associated with higher death rates due to COVID-19.
But the Harvard researchers could only access PM2.5 data on a county-by-county level within the United States. While a valuable starting point, county-level pollution statistics can’t drill down to a neighborhood next to a coal-fired power plant versus one next to a park that is 30 miles upwind. And most countries outside of the Western world don’t have that level of air quality monitoring.
“Ground stations are expensive to build and maintain, so even large cities aren’t likely to have more than a handful of them,” said Bergin. “So while they might give a general idea of the amount of PM2.5 in the air, they don’t come anywhere near giving a true distribution for the people living in different areas throughout that city.”
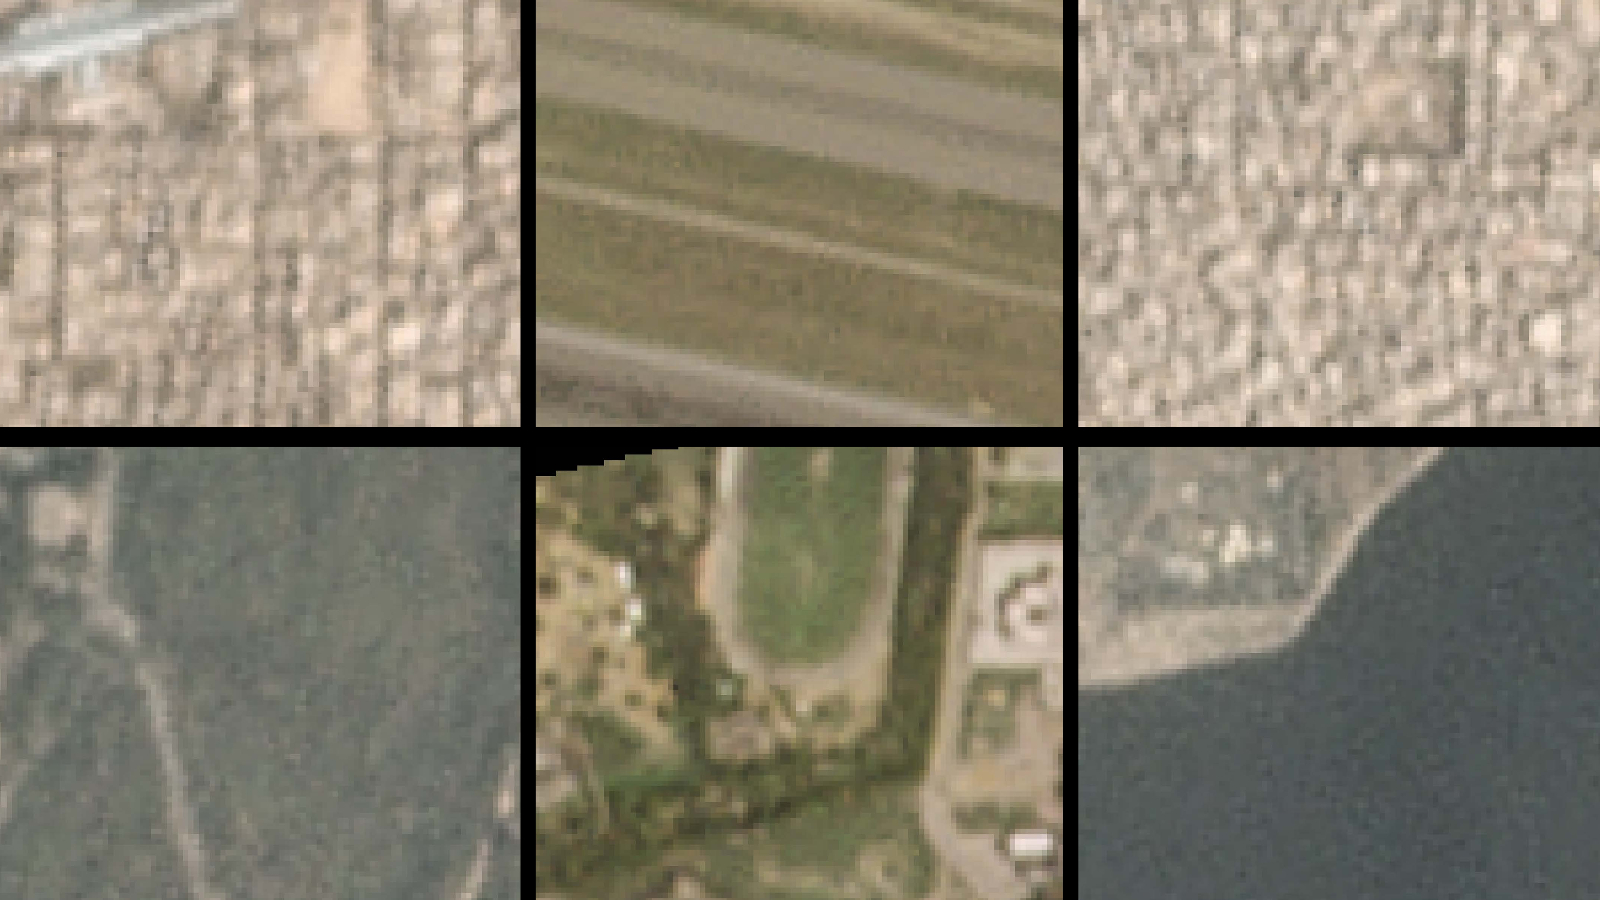
 In previous work with doctoral student Tongshu Zheng and colleague David Carlson, assistant professor of civil and environmental engineering at Duke, the researchers showed that satellite imagery, weather data and machine learning could provide PM2.5 measurements on a small scale.
Building off that work and focusing on Delhi, the team has now improved their methods and taught the algorithm to automatically find hotspots and cool spots of air pollution with a resolution of 300 meters — about the length of a New York City block.
The advancement was made by using a technique called residual learning. The algorithm first estimates the levels of PM2.5 using weather data alone. It then measures the difference between these estimates and the actual levels of PM2.5 and teaches itself to use satellite images to make its predictions better.
“When predictions are made first with the weather, and then satellite data is added later to fine-tune them, it allows the algorithm to take full advantage of the information in satellite imagery,” said Zheng.
“The next step is to see how these hotspots are related to socioeconomic status and hospital admittance rates from long-term exposures. I think this approach could take us really far and the potential applications are just amazing.”
– Mike Bergin
The researchers then used an algorithm initially designed to adjust uneven illumination in an image to find areas of high and low levels of air pollution. Called local contrast normalization, the technique essentially looks for city-block-sized pixels that have higher or lower levels of PM2.5 than others in their vicinity.
“These hotspots are notoriously difficult to find in maps of PM levels because some days the air is just really bad across the entire city, and it is really difficult to tell if there are true differences between them or if there’s just a problem with the image contrast,” said Carlson. “It’s a big advantage to be able to find a specific neighborhood that tends to stay higher or lower than everywhere else, because it can help us answer questions about health disparities and environmental fairness.”
While the exact methods the algorithm teaches itself can’t transfer from city to city, the algorithm could easily teach itself new methods in different locations. And while cities might evolve over time in both weather and pollution patterns, the algorithm shouldn’t have any trouble evolving with them. Plus, the researchers point out, the number of air quality sensors is only going to increase in coming years, so they believe their approach will only get better with time.
“I think we’ll be able to find built environments in these images that are related to the hot and cool spots, which can have a huge environmental justice component,” said Bergin. “The next step is to see how these hotspots are related to socioeconomic status and hospital admittance rates from long-term exposures. I think this approach could take us really far and the potential applications are just amazing.”
The results appeared online April 1 in the journal Remote Sensing.
This work was supported in part by the Duke Energy Initiative as well as the Office of the Provost at Duke University.
CITATION: “Local PM2.5 Hotspot Detector at 300 m Resolution: A Random Forest–Convolutional Neural Network Joint Model Jointly Trained on Satellite Images and Meteorology,” Tongshu Zheng, Michael Bergin, Guoyin Wang and David Carlson. Remote Sensing, April 1, 2021. DOI: 10.3390/rs1307135